
How to Write a Pitch Deck Storyline to Get You Funded
Have you ever poured your heart and soul into a startup, only to feel like your brilliant idea just isn't resonating with investors?
January 7, 2025
Learn which startup metrics to include in your pitch deck, how to present traction, market size, projections, and business model clearly.

Founders should present startup metrics in a pitch deck by choosing 2-3 core traction metrics, showing them visually, and tying each number to the business story.
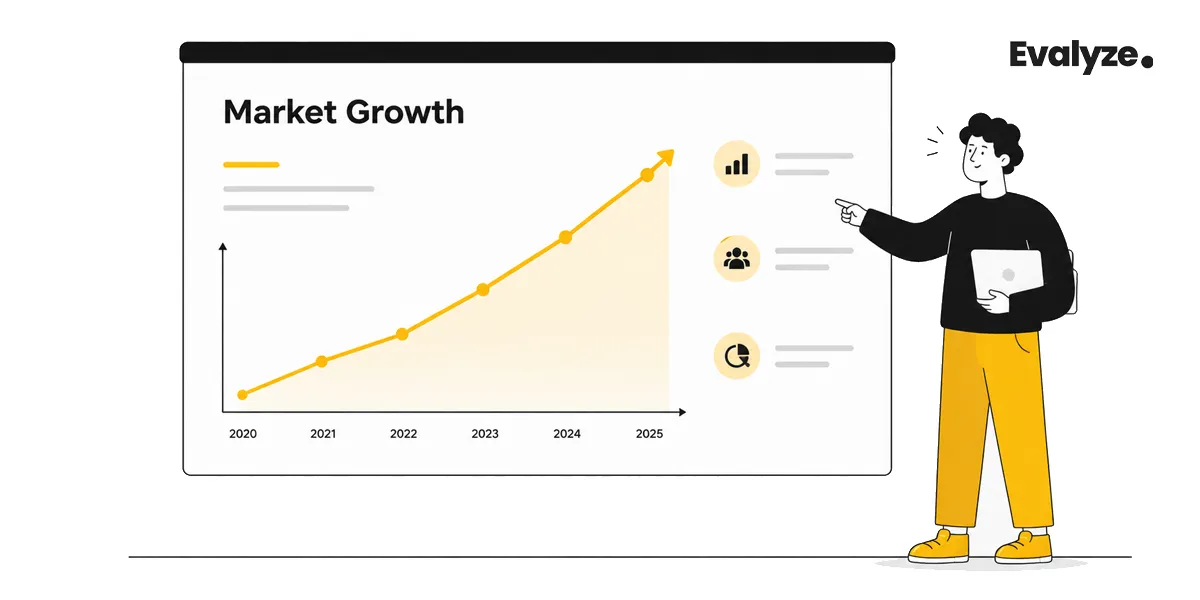
Investors do not want a spreadsheet pasted into a slide. They want to know what is growing, why it is growing, whether the growth can continue, and how the next round of capital will improve the numbers.
Key Takeaways
Your pitch deck should not show every metric you track. It should show the 2-3 numbers that prove your startup is working.
Use charts, trend lines, and sharp headlines instead of spreadsheet-style tables.
For pre-seed and seed, investors care most about traction, retention, unit economics, market logic, and how funding turns into milestones.
Financial projections should be tied to assumptions, burn, hiring, revenue drivers, and the next fundraising milestone.
A bottom-up TAM/SAM/SOM is more believable than a large top-down market number copied from an industry report.
A messy metrics slide creates the wrong signal fast.
You may think more data makes you look prepared. Investors often read it differently: unclear story, weak prioritization, or a founder who does not know which number matters most.
The best metrics slides do the opposite. They make one point immediately:
Revenue is compounding.
Retention is improving.
Customers are paying more.
CAC is becoming more efficient.
Usage is becoming habitual.
The raise will fund specific milestones, not vague growth.
That is the job of startup metrics in a pitch deck:
Not to show everything you know, but to prove the business is becoming more investable.
This is where your pitch deck storyline matters; the numbers should support the investor narrative, not compete with it.
Investors scan decks quickly. That means your metrics need to work without you standing next to the slide explaining every cell.
A table says, “Please analyze this.”
A chart says, “Here is what is happening.”
For most pitch deck metrics, a clean line chart or bar chart beats a grid of numbers. If MRR grew from $4K to $38K over eight months, do not bury that inside a 12-column table. Show the curve. Add a headline that explains the point.
❌ Weak headline: Revenue
✅ Stronger headline: MRR grew 9.5x in 8 months with 82% gross margin
Then the chart supports the claim.
Use tables only when comparison matters. For example:
| Metric | Q1 | Q2 | Q3 |
|---|---|---|---|
| Gross margin | 64% | 73% | 82% |
| CAC payback | 14 months | 10 months | 7 months |
| Logo churn | 5.8% | 4.1% | 2.9% |
Even then, keep the table small. Three rows. Three columns. One clear message.
A traction slide cannot show revenue, user growth, CAC, churn, retention, pipeline, and customer logos at the same time.
Pick the strongest proof point.
For example:
If you are pre-revenue but have high engagement, lead with retention or active usage.
If you are an early revenue, lead with MRR growth and gross margin.
If you are an enterprise SaaS with long sales cycles, lead with signed pilots, pipeline quality, or expansion inside early accounts.
If you are a marketplace, lead with liquidity, repeat transactions, or supply-demand density.
A slide should answer one investor question at a time.
Traction slide: Is the product working?
Business model slide: Can this become a real business?
Market slide: Can this become large enough for venture returns?
Use of funds slide: Will this capital create the next proof point?
Once you mix all four questions into one slide, the investor has to do your work for you. Most will not.
Design every metrics slide as if the investor has less than three minutes with the entire deck.
That means:
Use one bold headline.
Label axes clearly.
Remove tiny legends.
Avoid decimal overload.
Highlight the main number.
Add one short note explaining the driver behind the change.
A good slide can be understood in seconds.
Example:
❌ Bad slide title: Monthly KPI Overview
✅ Better slide title: Net revenue retention reached 118% as teams expanded from 3 to 11 seats
That headline tells the investor what to notice before they even look at the chart.
Before you send your deck
If your metrics slide still looks like a spreadsheet, run it through Startup Analyzer to see how clearly your traction, financials, and business model come across to investors.
Score Your Pitch Deck
The right metrics depend on your business model and stage. A pre-revenue AI infrastructure startup, a consumer app, and a B2B SaaS company should not use the same traction slide.
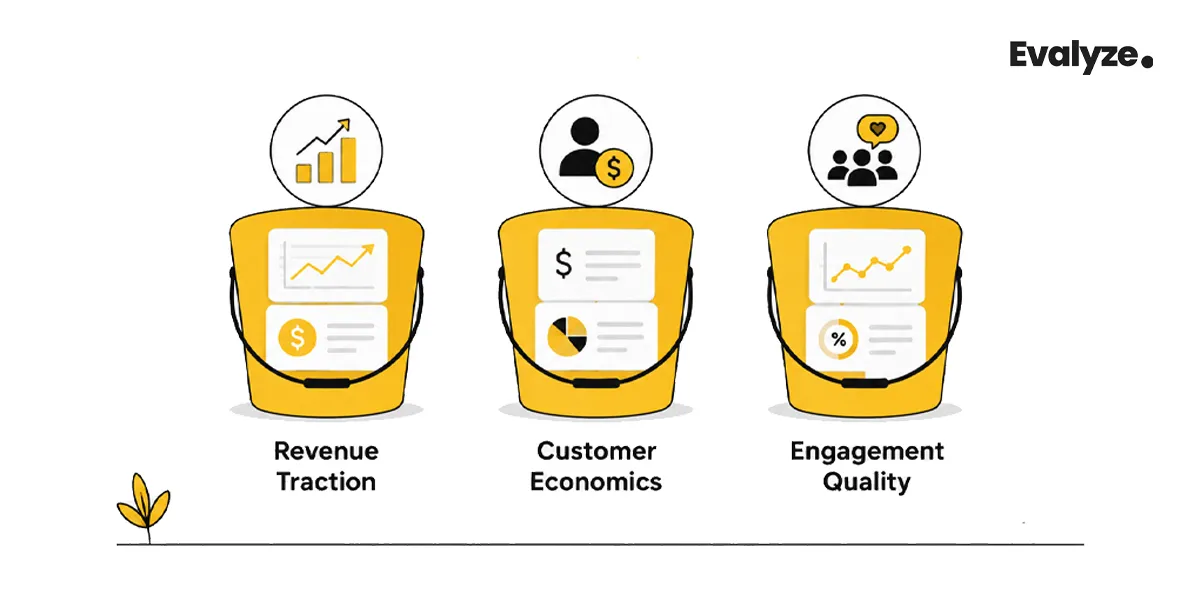
Still, investors usually sort metrics into three buckets:
revenue traction,
customer economics,
and engagement quality.
For a wider view of how investors read these signals, see our guide on what investors look for in pitch decks.
Use these when you have paying customers or signed commercial commitments.
MRR is the predictable subscription revenue your startup generates each month. It matters most for SaaS and subscription businesses.
Show:
Current MRR
Month-over-month growth
Net new MRR
Expansion MRR
Lost MRR, if churn is material
Stronger framing:
MRR grew from $6K to $52K in 10 months, with 38% coming from expansion revenue.
That tells a better story than simply saying:
ARR is usually MRR multiplied by 12. Use ARR when the number is meaningful enough to help investors understand scale.
Be careful with fake ARR. If you had one strong month and annualized it, investors will notice. A sudden “$1M ARR run-rate” claim after one month of revenue often raises more suspicion than excitement.
Show the base, not just the annualized number.
Better:
$84K MRR in May 2026, equal to $1.0M ARR run-rate, with 92% logo retention across the last two cohorts.
Gross margin shows how much revenue remains after direct costs. For software and AI startups, this matters more in 2026 because infrastructure, model inference, human review, and support costs can quietly damage the business model.
Show gross margin early if it is strong. If it is weak, explain why it improves with scale.
Example:
Gross margin improved from 48% to 71% after model routing reduced inference cost per report by 43%.
That is a real operating story.
These metrics prove whether growth is efficient or expensive.
CAC is the cost to acquire a paying customer. Do not show one blended CAC number if your channels behave differently.
Break it down:
| Channel | CAC | Payback | Notes |
|---|---|---|---|
| Founder referrals | $120 | 2 months | Highest retention |
| LinkedIn outbound | $410 | 6 months | Strong for seed-stage SaaS |
| Paid search | $780 | 11 months | Works only for high-intent keywords |
This tells investors you know where growth comes from and where it breaks.
LTV estimates how much gross profit a customer creates over time. Early-stage founders often overstate it because they do not have enough retention history.
For pre-seed and seed, it is safer to show:
Average revenue per account (ARPA)
Gross margin
Early retention
Expansion signals
CAC payback
If you use LTV, show the formula and assumptions.
❌ Bad: LTV:CAC is 12:1.
✅ Better: Estimated LTV:CAC is 4.1:1 based on $240 monthly ARPA, 78% gross margin, and observed 4.5% monthly churn across the last 6 months.
That is easier to trust.
Churn tells investors whether customers stay. Show churn by cohort or segment, not only as one average.
A single churn number can hide the truth. Maybe small customers churn quickly, while mid-market accounts stay. Maybe users acquired through paid ads churn faster than referrals. Maybe early cohorts were weak, but recent cohorts are improving.
Investors want to see that you know the difference.
For pre-revenue or low-revenue startups, engagement can be the strongest proof of demand.
Use these when revenue is still early:
Daily Active Users (DAU)
Monthly Active Users (MAU)
DAU/MAU ratio
Weekly active teams
Repeat usage
Activation rate
Cohort retention
Number of workflows completed
Usage frequency per account
For a consumer app, DAU/MAU may matter. For a B2B workflow tool, weekly active teams or completed workflows may matter more.
Do not show signups as your main traction metric unless signups directly predict revenue or usage.
“10,000 signups” is usually weaker than “64% of new teams complete their first workflow in 24 hours, and 41% return weekly by week four”.
That second version proves behavior.
| Startup Type | Strong Metrics | Weak Metrics |
|---|---|---|
| B2B SaaS | MRR, ARR, gross margin, churn, CAC payback, NRR, expansion revenue | Total signups, website visits, waitlist size |
| Consumer app | DAU, MAU, retention, session frequency, organic growth, paid conversion | Downloads without retention |
| Marketplace | GMV, take rate, repeat transactions, liquidity, supply-demand match rate | Total listed users |
| AI startup | Revenue, usage frequency, gross margin after inference cost, workflow completion, data advantage | “AI-powered” claims without adoption |
| Enterprise SaaS | Pilots, pipeline quality, sales cycle, ACV, conversion from pilot to paid, expansion | Logo screenshots without contract value |
A market slide fails when it says, “This is a $500B market, so if we capture 1%, we are huge.”
Investors have seen that slide too many times. A stronger market slide starts with the customer and builds upward.
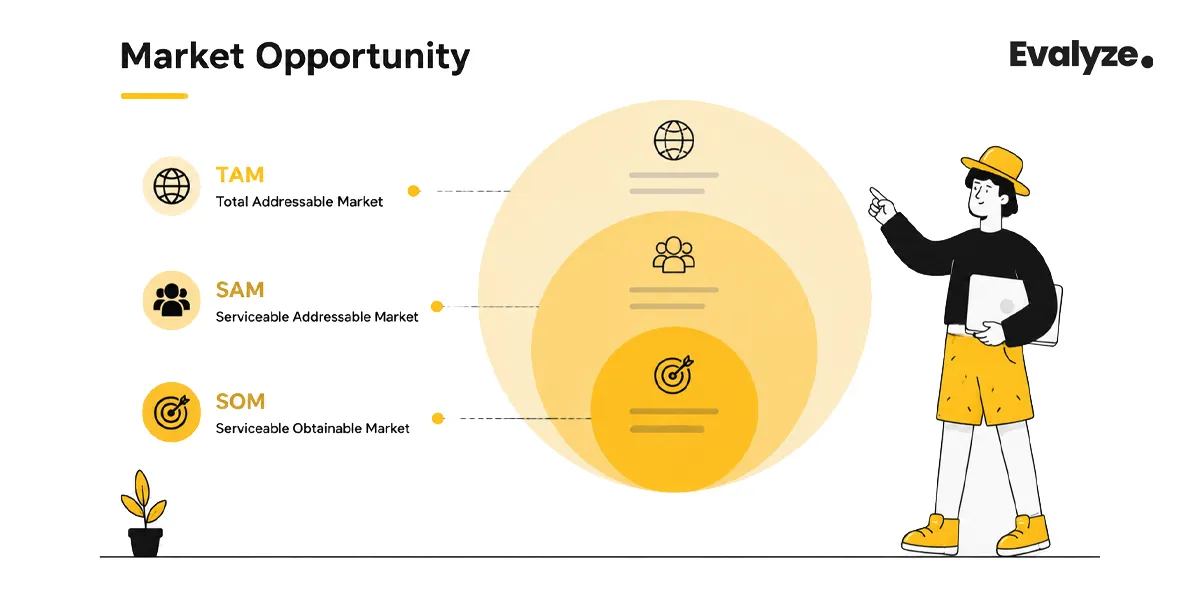
TAM is the total possible demand if every potential customer used your product.
For example, if you sell compliance software to all financial institutions globally, TAM estimates the full market across all possible geographies and customer segments.
Use TAM to show the ceiling.
Do not pretend TAM is your near-term revenue plan.
SAM is the part of the market you can actually serve with your current product, pricing, geography, and go-to-market motion.
If your product only serves US-based fintech lenders with 50-500 employees, your SAM is not the entire global compliance software market.
SAM answers:
Which part of the market can we realistically sell into?
SOM is the portion of SAM you can realistically capture over a specific time period.
This is where your market slide becomes credible.
SOM should connect to:
Target customer count
Average contract value
Sales capacity
Conversion rate
Market entry sequence
Competitive reality
A bottom-up market calculation starts with actual customer logic.
Example:
Target segment: US fintech lenders with 50-500 employees
Estimated target accounts: 8,000
Average annual contract value: $18,000
SAM: 8,000 × $18,000 = $144M
5-year obtainable share: 8%
SOM: $11.5M ARR
This is more defensible than saying:
The global fintech software market is $80B. If we get 1%, we make $800M.
Investors do not fund percentages of giant markets. They fund a believable path from a specific customer segment to a venture-scale company.
Your market slide should answer:
Who buys?
How many of them exist?
How much do they pay?
How do you reach them?
Why does this segment expand into a larger market later?
Example:
Beachhead: 8,000 US fintech lenders
Expansion: 31,000 credit unions, payment companies, and embedded finance platforms
Long-term TAM: broader financial compliance automation
That sequence feels real because it starts narrow and earns the larger story.
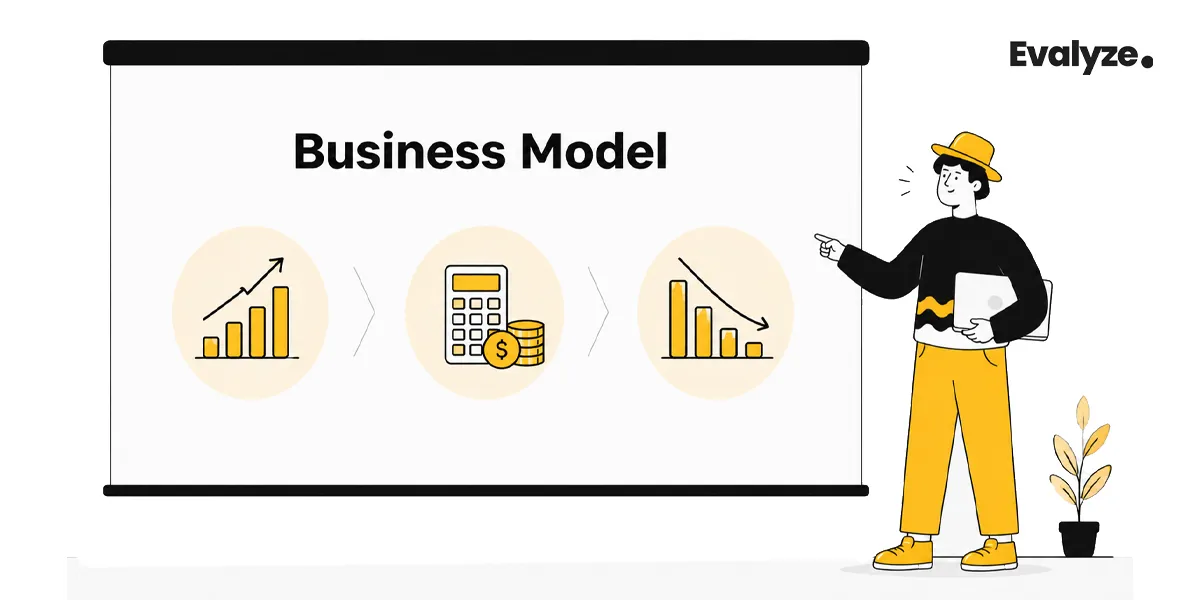
Your business model slide answers one question:
How does this become a large, profitable company?
Do not hide pricing in the appendix. If customers pay, show how. If they do not pay yet, show the expected pricing model and what evidence supports it.
Use plain language.
Examples:
Subscription: $299/month per team
Usage-based: $0.08 per automated workflow
Transaction fee: 3% take rate on completed payments
Enterprise license: $36K–$120K annual contracts
Hybrid: platform fee plus usage-based overages
Then show why that model fits the customer.
A strong business model slide includes:
Who pays
What they pay for
Average contract value or expected ACV
Gross margin logic
Expansion path
Pricing proof, if available
A price point alone is thin. Pricing strategy shows investor-level thinking.
Example:
We start at $299/month for founder-led teams, expand to $1,200/month for multi-seat teams, and move to annual contracts once teams connect CRM and investor workflows.
That sentence says more than a pricing table. It shows land-and-expand logic.
Investors want to know how the product reaches customers.
For B2B SaaS, clarify:
Product-led growth
Founder-led sales
Sales-assisted onboarding
Enterprise sales
Channel partnerships
Marketplace distribution
Community-led acquisition
Then connect the motion to CAC and payback.
Example:
Founder-led sales currently close at 18% from qualified demo to paid. We are raising to hire one AE after reaching $75K MRR, not before.
That sounds disciplined.
Early-stage startups often have messy revenue. Services, pilots, discounts, one-off contracts, and custom onboarding may all appear in the first year.
That is fine if you explain the migration path.
Example:
Today: $12K paid pilots with hands-on onboarding.
Next 12 months: convert pilots into $24K annual software contracts.
After seed: add usage-based automation fees for high-volume accounts.
Now the investor can see the bridge.
Not sure if your business model slide is clear enough?
Use Evalyze AI Pitch Coach to review your pricing, revenue model, and investor narrative before you start outreach.
Fix Your Pitch Deck
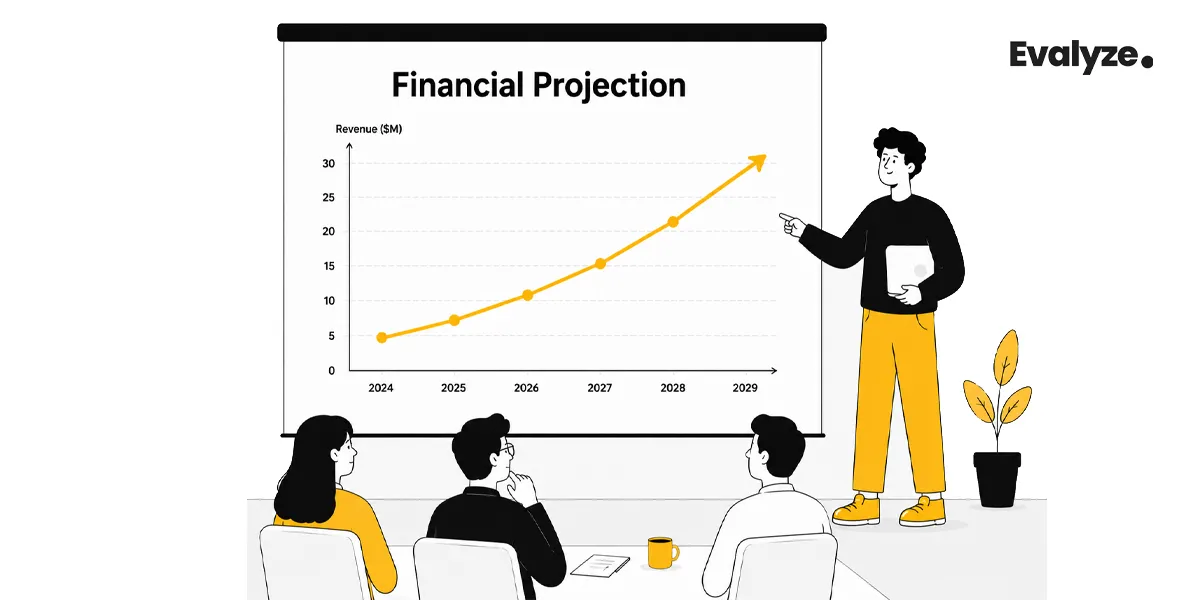
Financial projections are not promises. They are a model of how your business could work if your assumptions are correct.
Investors know your five-year forecast will be wrong. They still want to see it because it reveals how you think.
Do not paste a full financial model into the pitch deck.
Your financial slide should show:
Revenue forecast
Gross margin
Burn
Runway
Headcount
Key assumptions
Milestone target
A clean 3-year view is usually enough for pre-seed and seed.
| Metric | Today | 12 Months | 24 Months |
|---|---|---|---|
| ARR | $180K | $750K | $2.4M |
| Gross margin | 68% | 76% | 82% |
| Customers | 24 | 85 | 210 |
| Monthly burn | $42K | $95K | $160K |
| Runway | 7 months | 18 months | 14 months |
| Team size | 5 | 11 | 18 |
The detailed spreadsheet belongs in the data room, not the main deck.
A revenue projection without drivers feels invented.
Show the math behind the forecast:
Number of customers
Average revenue per account
Conversion rate
Sales cycle
Churn
Expansion
Pricing changes
Hiring plan
Channel mix
Example:
We reach $750K ARR by closing 61 net new accounts at $9.6K average ACV, assuming 14% demo-to-close conversion and a 45-day sales cycle.
This is far stronger than:
Use three cases if your assumptions are still uncertain.
| Scenario | 12-Month ARR | Assumption |
|---|---|---|
| Conservative | $480K | 9% demo-to-close, no expansion revenue |
| Base | $750K | 14% demo-to-close, 12% expansion revenue |
| Upside | $1.1M | 18% demo-to-close, 22% expansion revenue |
Investors do not need you to pretend the upside is guaranteed. They need to see that you know what has to be true.
A pre-seed financial model with 14 tabs, international expansion, 200 employees, and 0.1% churn does not look sophisticated. It looks detached from reality.
For early-stage fundraising, focus on the next 18–24 months.
That is the window your investor is underwriting.
The use-of-funds slide is where many founders lose credibility.
❌ Bad version: We are raising $1.5M for product, marketing, and hiring.
✅ Better version: We are raising $1.5M to reach $750K ARR, 80% gross margin, and 100 qualified enterprise opportunities within 18 months.
That version ties capital to measurable progress.

Investors want to know what their money unlocks.
Use this structure:
| Funding Use | Amount | Milestone | Metric Impact |
|---|---|---|---|
| Product engineering | $520K | Launch self-serve onboarding and analytics dashboard | Increase activation from 42% to 60% |
| Go-to-market | $430K | Hire 1 AE and run 3 outbound experiments | Grow ARR from $180K to $750K |
| Customer success | $210K | Build onboarding and retention playbooks | Reduce monthly logo churn below 3% |
| Buffer and operations | $340K | Maintain 18 months runway | Protect fundraising timeline |
This is how you make projections investable.
A simple formula works well:
Raise = monthly burn × months to milestone + buffer
Example:
If you need 12 months to reach the next funding milestone and expect to burn $80K/month, you probably need more than $960K. Add buffer. Fundraising takes time, and the next round rarely closes the day you hit the metric.
A more realistic ask might be:
$1.4M-$1.5M to fund 12 months of execution plus 6 months of fundraising buffer.
If you are still calibrating the round size, compare your assumptions with our guide on how much to raise at pre-seed or how much to raise at seed stage.
The investor is not only asking, “Can this company use my money?”
They are asking:
Will this company be fundable at the next round?
So name the next-round proof points.
Example:
This round gets us to seed-ready metrics: $750K ARR, sub-8-month CAC payback, 80% gross margin, and 110% net revenue retention across our first 100 customers.
This gives investors a clear view of the next financing milestone.
You can also use the pre-seed fundraising checklist to see whether your metrics, deck, and raise plan are ready for investor conversations.
Keep the deeper numbers ready.
Your main deck should stay clean, but investors may still ask for projections, cap table details, financial assumptions, and supporting documents. Use the Evalyze Data Room to keep your fundraising materials organized in one place.
Organize Your Fundraising Docs
Use this order if you are building or revising your pitch deck.

Show the company vision and your strongest traction signal.
Example:
AI compliance workflows for fintech teams $52K MRR, 91% logo retention, 3.4x expansion in 8 months.
Show the pain, cost, frequency, and urgency.
Metrics that work here:
Hours wasted
Cost of current workflow
Error rate
Compliance risk
Customer pain frequency
Show the product outcome, not every feature.
Metrics that work here:
Time saved
Cost reduced
Workflow completion
Accuracy improvement
Adoption after onboarding
Use bottom-up TAM/SAM/SOM.
Metrics that work here:
Target accounts
ACV
Beachhead segment
Expansion segment
Obtainable share
Use 1-2 core traction metrics.
Best options:
MRR/ARR growth
Retention
Paid customer growth
Usage growth
Pilot-to-paid conversion
Expansion revenue
Show pricing, gross margin, CAC logic, and expansion.
Show burn, runway, milestones, and projected metric improvement.
Put deeper data here:
Cohort charts
CAC by channel
Full financial model
Retention by segment
Pipeline by stage
Customer concentration
Expansion analysis
For a broader slide-by-slide structure, read our guide to creating an unignorable startup pitch deck.
Before investors question your numbers, they judge how clearly you understand them.
More metrics do not create more trust. They usually dilute the story.
🔨 Fix it: choose the one metric that proves momentum and the one metric that proves quality.
Example:
Momentum: MRR growth
Quality: retention or gross margin
Waitlist size, pageviews, impressions, and total signups can support the story. They should rarely lead the story.
🔨 Fix it: pair vanity metrics with behavior.
Instead of: 25,000 signups
Use: 25,000 signups, 38% activated, 44% of activated users returned in week four.
If churn is high, CAC is rising, or gross margin is low, investors will find out. Hiding the number makes the problem worse.
🔨 Fix it: show the issue and the operating plan.
Example:
Logo churn is 6.2% per month in SMB accounts but 1.4% in mid-market accounts. We are shifting the acquisition to teams with above 50 employees.
That shows judgment.
Investors do not believe perfect projections.
🔨 Fix it: show assumptions and sensitivity.
A giant TAM number without customer logic is not persuasive.
🔨 Fix it: build the market from target accounts and pricing.
Before sending your deck, you can run an AI pitch deck review to check whether your traction, market, business model, and financial slides are investor-ready.
Your pitch deck metrics should do one thing: make the investor’s job easy.
Give them clear traction, trustworthy assumptions, and a vivid picture of what the next round of capital will unlock.
FAQ
Have you ever poured your heart and soul into a startup, only to feel like your brilliant idea just isn't resonating with investors?
January 7, 2025

what exactly are investors looking for in a pitch deck? While every investor has their own preferences, there are universal elements that can make or break your pitch.
February 6, 2025